

When the University of Virginia went into lockdown for the second time in a week in February, Ckalib Nelson, a Charlottesville-based data scientist, was caught off guard.
First, there was an hours-long lockdown while the state, county, city, and UVA police departments chased a man after he fled from a traffic stop on Feb. 25. Then, two days later, UVA’s emergency alert system told everyone on campus to “run hide fight” as the police pursued a suspect in a stabbing. This is a more severe alert directing students and staff on how to respond to an active assailant or shooter.
“I thought that was wild, because, statistically speaking, that just doesn’t sound like it happens often,” said Nelson after reading about the back-to-back events in Charlottesville Tomorrow.
The last time Nelson remembered something like this happening was the November 2022 shooting at UVA that resulted in the deaths of three students and the injury of two others. He wanted to figure out how the February events fit into broader patterns in Charlottesville.
“I couldn’t find a tool that would tell me what I needed to know about the crime and safety in Charlottesville,” he told Charlottesville Tomorrow. “So I found the data myself and decided to build a dashboard.”
That’s how the “Charlottesville Crime Data” dashboard and map came to be.
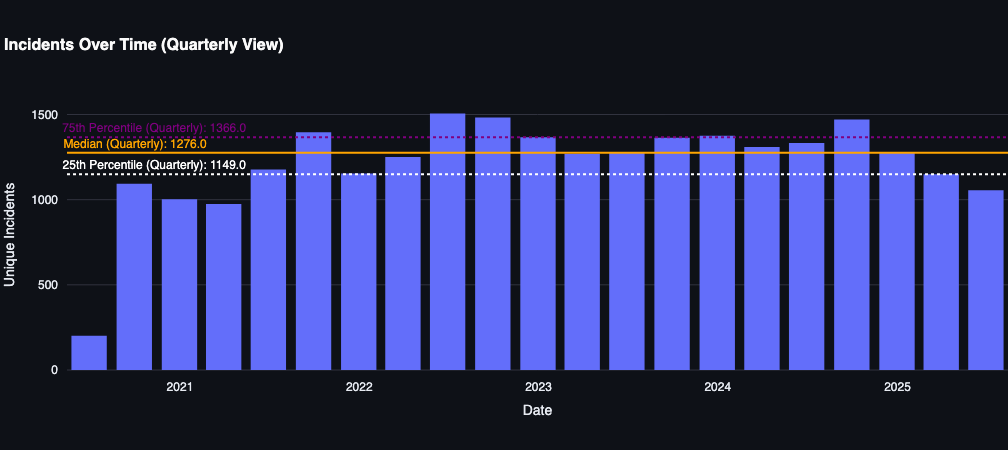
The dashboard includes data and related graphs and maps that show the number of calls for police assistance over time, where they are reported in the city, the type of incidents most often reported, and when they are reported, including time of day and day of the week.
Nelson, who works as an engineer for Amazon during his work hours, used raw data compiled by the Charlottesville Police Department and made available on Open Data Charlottesville to build an approachable, easy-to-digest tool to see what kinds of incidents are reported and where they take place.
According to the summary on Open Data Charlottesville and that Nelson includes on the dashboard, the underlying data is updated by CPD nightly. The data includes “the initial information that is provided by individuals calling for police assistance,” and “information is often amended for accuracy after an officer arrives and investigates the reported incident.” The data is focused on reported incidents rather than convictions of any crimes, and the summary also advises residents to view the data with caution, “as they may not represent the official crime reports.”
After a push from people Nelson shared the site with for peer review, he decided to open it to the public.
“I sat on that for a minute, because crime is a very sensitive topic, and also incredibly sensitive data. There’s a lot of conversation about the integrity of the data, whether it has been recorded properly,” said Nelson.
“But I thought that what would do the most good is to allow the tool to be available to the public and then provide some context behind why I created it.”
The website launched on March 21, and Nelson announced it to the world on his LinkedIn page.
“The dashboard offers intuitive filters and visualizations to reveal crime trends, which may aid in resource allocation and crime prevention efforts,” he wrote in the post.
“By combining this with additional datasets, users can uncover further insights into community dynamics. I am not here to assign blame; instead, I aim to foster empathy and to help identify opportunities for enhancing safety in our community.”
Early feedback was positive, full of follow-up questions and suggestions.
“What an amazing contribution you’ve made to our community’s ability to research and understand the nature of crime in our city,” one person commented.
Nelson also shared key insights from the last five years of crime data in the city:
The number of calls to police are down. So far in 2025, incidents dropped 21% compared to this time last year.
Just seven types of “offenses” make up half of all reports this year, the most common being hit-and-run, assault, suspicious activity and vandalism.
The most common reported incidents are hit-and-run, which felt surprising to Nelson. But, considering that hit-and-run can include injury to a person or damage to property, such as another car, the data made more sense when he looked at the map where most cases take place.
“When I looked at where those incidents are occurring, which is those major streets, like Barracks, the Barracks area and then the highway, it made sense to me that those incidents would be frequent,” he said.
“Fortunately, crime seems to be improving — if the data integrity is spotless. We don’t have rising crime rates.”
Nelson, who moved to Charlottesville in 2015 from Winston-Salem, North Carolina, has been actively involved in the community — he volunteers with Computers4Kids, a local nonprofit mentoring youth in STEM. He is also involved with Live Arts, a volunteer-run theater, and he is a Board member at the Community Investment Collaborative, a nonprofit supporting local businesses.
Nelson isn’t planning to stop working on city data — the next stop is creating an education data dashboard to provide insights into absenteeism rates and performance at local public schools. He spoke with community members who expressed interest in this kind of dashboard.
“I definitely do not want to stop,” he said. “I want to continue building other data products.”